It's too early for a detailed weather forecast for this year's Rolex Fastnet Race, but navigator Ian Moore has crunched some historical data to work out what, statistically, should be the optimum route. And he found some surprising things...
With tricky tides, imposing headlands and the vagaries of the British summer weather to contend with, the Rolex Fastnet Race is as much about tactics as it is about boat speed. Expert navigator Ian Moore takes a detailed look at possible Fastnet routes based on real weather data over five years.
Weather study
Everyone knows that the Fastnet Race is a beat out to the Rock and a run home, but we decided to test the theory with a weather study. Most weather studies – such as those conducted for the Volvo Ocean Race – are compiled using historical weather data and routeing software. This allows you to sail a virtual race thousands of times through weather data that fairly represents real weather features such as fronts, highs and lows, and the intertropical convergence zone.
The optimum paths are determined by calculating courses through the moving and evolving weather features in much the same way as an actual race would be sailed.
By making progressive adjustments to a boat’s polar, the designer can compare performance results on literally hundreds of candidate sail and rating combinations in a relatively short time by sailing through all the various weather patterns.
This approach has been used for many years and studies have contributed to significant design breakthroughs in the Volvo Ocean Race, TransPac and Vendée Globe. Many such studies are performed using a software package known as The Router, written and maintained by Michael Richelsen of North Sails.
Richelsen originally developed his package for the Illbruck Challenge campaign, which went on to win the 2001-02 Volvo. Since that time, Richelsen’s work has been used by most of the Volvo teams, paired with historical weather data provided by Sailing Weather Service of the USA.
Using historical data
For our analysis, Chris Bedford, chief meteorologist at Sailing Weather Service, provided us with a subset from their global historical data set which extends back to 1979. Wind data is provided at six-hour intervals on a 0.25° latitude by 0.25° longitude grid – nearly three times the resolution of a commonly used public-domain forecast model, the GFS from the US National Weather Service.
This data is far superior to a forecast model since it uses data and analyses that are not available to forecast models. The finer resolution also allows a truer representation of winds associated with local circulations such as sea and land breezes, and geographic effects.
However, even at this scale, some of the most interesting local effects are too small to be resolved. While retrospective data sets down to 1km resolution are available, the resources needed for such analysis exceeded the capacity of our study.
We chose a TP52 and a Bénéteau 40.7 as our two trial horses and for each boat we made ten runs in each year’s data, five days either side of the 2011 start date, a total of 50 runs for each boat. The result produces 100 optimum routes to the Fastnet Rock.
Having crunched the numbers, we found the data supports an earth-shattering conclusion: it’s a beat to the Rock and a run home!
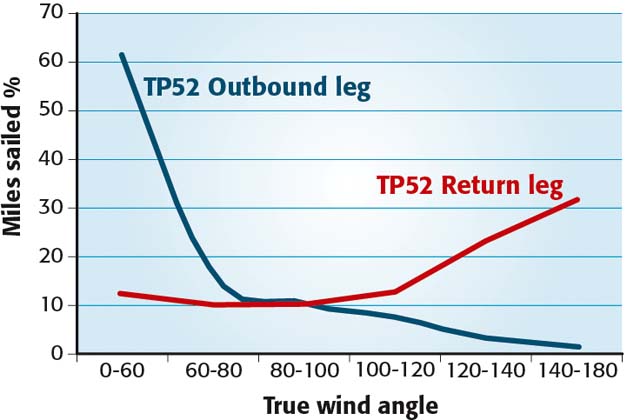
In fact, statistically it’s more likely to be a beat to the Rock than it is to be a run to the finish. Some 77 per cent of the miles sailed on the outward leg had the wind forward of 80° TWA while only 67 per cent of the miles sailed on the return leg were abaft 100° TWA.
This is, of course, because of the predominant westerly wind direction. In the optimum routeing 72 per cent of the miles were sailed in winds between north-west and south-west and only nine per cent between north-east and south-east. This left about ten per cent apiece for a northerly or southerly.
Continues below…
Fastnet Race strategy: course record breaker Hugh Agnew identifies the key navigation moments
One of the world’s classic offshore races, the Rolex Fastnet Race is also one of the most tactically demanding. Multiple tidal…
Iconic Fastnet headlands that can make or break your race – and how to round them
There are three major headlands on the Rolex Fastnet Race route that are key to the success or otherwise of your…
Everything you need to know about the 2021 Rolex Fastnet Race
The Rolex Fastnet Race is one of the world’s most iconic offshore racing challenges – here’s everything you need to know…
Not windy
The good news is – and I can’t believe I’m committing this to paper – that it shouldn’t be that windy, though the study results are mean wind speeds at 10m and don’t include gusts.
What this means in reality is when the model says you will have six knots, then you will probably have about six knots or less. When the model says 22 knots, you are more likely to have 25 knots at the masthead and gusts to 30 are possible.
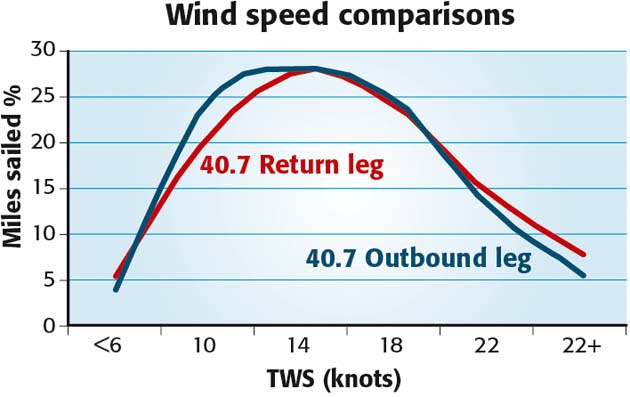
The study showed 75 per cent of the miles should be between six and 18 knots (at 10m), and only six per cent over 22 knots. The return leg is a fraction windier, with almost eight per cent of the miles over 22 knots, predominantly because all the analyses show the windiest section of the race is the leg across the Celtic Sea to the Rock.
If we compare the distributions for the different boats, they are really quite similar. The outbound legs are identical, but the return leg shows some variation mostly due to the polar performance at reaching angles.
The 40.7 is comparatively slow spinnaker reaching and spends slightly more time reaching at 80-120° (bring a jib top) than the TP52, which prefers the A3 at 120-140° TWA.
The routes themselves are a bit more interesting, in particular the proliferation of offshore routes. Historically, it is just windier in the middle of the Channel than it is along the shore.
None of the routes goes into Lyme Bay. The study highlights this as a black hole, an area of particularly light wind. So there seems little merit in playing this bay.
Between Start Point and the Lizard there are a few more inshore routes as this is more likely to be a sea breeze section of the course, but they are still outnumbered by the rhumb line or offshore routes.
From Land’s End to the Rock there are more optimum routes to the north of the rhumbline than to the south, but there is little to infer from the data. This leg is historically an even racetrack, so go either side for pressure or shift.
The same is true for the leg back to Land’s End, but after Bishop’s Rock we see a great many more routes approaching the finish from offshore than along the coastline.
Weather studies are normally done in the design phase of a new boat or to help design a sail wardrobe, but in this case we are using it to try to understand the racetrack. When it comes to the race itself, we will all make our decisions based not on a weather study, but on the best forecast we have at the time.
However, perhaps this will give you confidence when the navigator insists he wants to go offshore or make you think twice before you tack into Lyme Bay.


